Unlocking Business Potential: 4 Key Benefits of Social Graph Mapping in Your Community
We recently redesigned our feature to analyze social graphs/ maps and we would like to take this an opportunity to review the benefits of creating a social graph of your audience/ community.
The key four benefits are the following and we will detail and illustrate with examples in the next sections:
Targeted marketing and advertising
Identification of audience segments and clusters
Enhanced network analysis and relationship building
Competitive analysis and strategy development
1- Targeted marketing and advertising
By understanding the connections and interests within a social graph, businesses can identify key influencers and create targeted marketing and advertising campaigns. This allows for more efficient use of marketing resources, as well as higher engagement and conversion rates.
Here is an example of the eCairn’s ecosystem (i.e people following us in Twitter)

The eCairn ecosystem
If I want to build an influencer program within this ecosystem and I want to reach a maximum number of people only engaging with let’s say 25 influencers, this map enables me to pick influencers who are from different part of the graph and reach out different sets of people.
I would probably pick 10 top influencers from the blue cluster 10 from the green one and 5 from the red one.
This would maximise my reach with a small number of engagements.
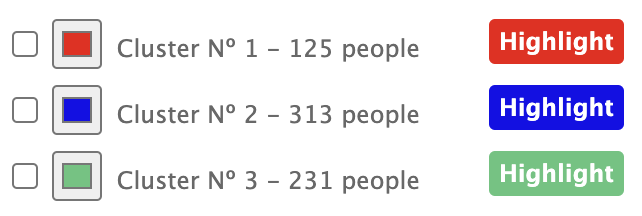
2. Identification of audience segments and clusters
A social graph enables businesses to discover distinct segments or clusters within their target audience. By identifying these groups, companies can tailor their products, services, and messaging to better meet the unique needs and preferences of each segment, resulting in more effective marketing and increased customer satisfaction.
Using our map of deep learning influencers (~15000 influencers in deep learning), we clearly see that this audience is made up of two distinct segments

Map of top 10 000 influencers in Deep Learning - node with lower influence are not displayed
How can we understand these two segments ?
One thing we can do is for each segment, look at who these people are, their bio, location and what they are talking about. In this example, analyzing their content shows that the red cluster is talking more about “data” whereas the cluster green is talking more about “models”. Cluster “green” tend to be also more technology focus whereas the “red” cluster seems to get more a business focus into ai/deep learning.

Cluster Red

Cluster Green
3. Enhanced network analysis and relationship building
Mapping a social graph allows businesses to understand the complex relationships within a community. This knowledge can be used to identify and nurture relationships with key stakeholders, thought leaders, and potential partners, which can lead to increased brand exposure, new opportunities, and stronger connections within the community.
This is really important when, as an SMB, you want to reach top influencers and celebrities. You can build a strategy where you leverage (micro) influencers who can lead you to top influencers.
It is also interesting in an ABM context. Let’s imagine you may the directors and executives of a large corporation, you can discover hidden relations (maybe between a tech person and an executive) and leverage this in your outreach strategy.
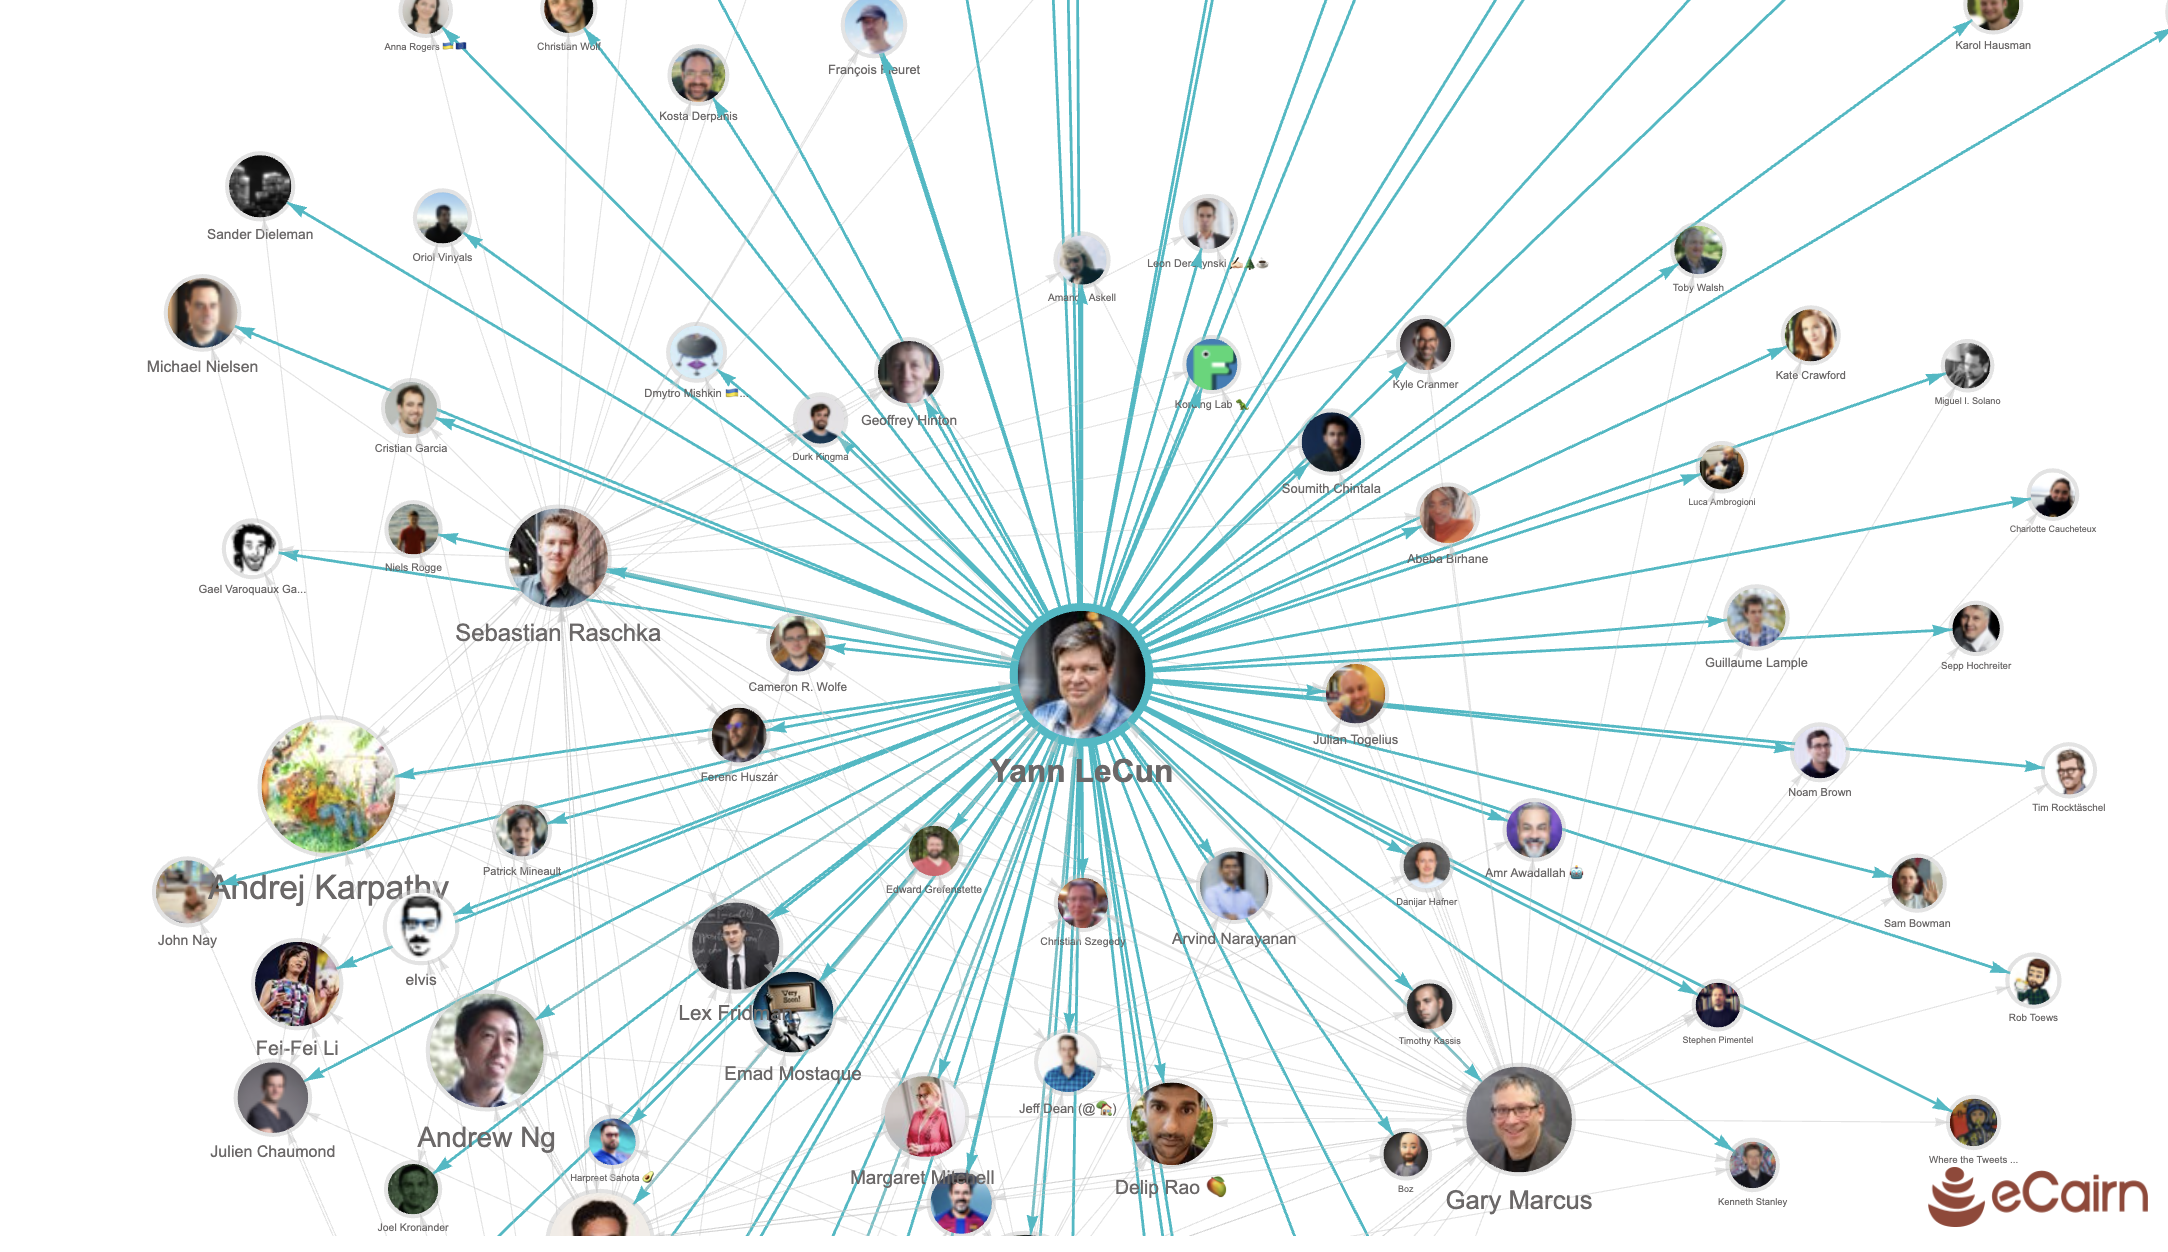
Let’s say I am interested in meeting Yann LeCun (https://en.wikipedia.org/wiki/Yann_LeCun), I may start engaging with people he interacts with frequently and are easier to reach.
4.Competitive analysis and strategy development
By examining the social graph of a specific community, businesses can gain insights into the competitive landscape, as well as their position within it. This can help companies identify gaps in the market, develop strategies to differentiate themselves from competitors, and capitalize on new opportunities that may arise within the community.
This is something we do a lot for clients. We map ecosystems and position the client account and their competitors in the map.
If you’re interested in a demo focused on social graph analysis, please contact us here: